| 8.3. Legends, options and explanation tabs | ||
|---|---|---|
 | Chapter 8. Tools |  |
| 8.3. Legends, options and explanation tabs | ||
|---|---|---|
| | Chapter 8. Tools | |
Each map is associated to a set of three tabs that provide tools to control and to understand the cartography. The choices are valid for the current map. Figure 8.2 displays each the "Options" tabs for an indicator map (that shows proportional circles) while Figure 8.3 displays the available options on a deviation map (palett of colors). The user may also set the thresholds for each class. The "Legend" tab displays the bounds of the classes (left), the number of items for each of them (right), and the associated color. The "Explanation" tab displays some general notes about the goal of the current map.
Figure 8.2. Options for proportional circles
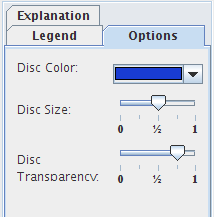
The "Options" tab of the numerator or denominator maps aims at setting the representation of the indicator values by selecting a color, the size and transparency of proportional circles.
Figure 8.3. Options for deviation maps
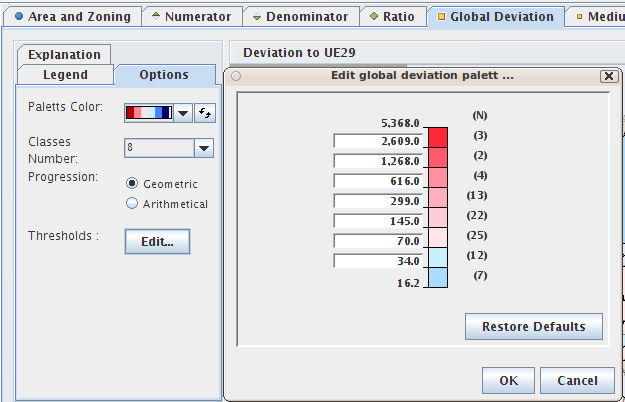
The "Options" tab of the deviation maps aims at setting the representation of the deviation by selecting:
the palett of colors, that can be reversed
the number of classes, between two and ten classes
the progression:
arithmetic for classes with an equal amplitude, better choice when the distribution is symmetric around 100.
geometric for classes with an increasing amplitude
the thresholds, that can be edited for each class
| |  | |
| 8.2. Appearances and functions of the mouse cursor |  | 8.4. Zoom |