| 6.2. View menu | ||
|---|---|---|
 | Chapter 6. Overview |  |
| 6.2. View menu | ||
|---|---|---|
| | Chapter 6. Overview | |
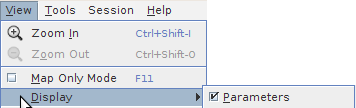
This menu concerns the appearance of the maps. It provides menu items to zoom in, zoom out and to choose the different panels that can be displayed as different parts of the window:
the "Map only mode - F11" allows to display the map frameset as wide and high as possible;
the "Display - Parameters" menu item makes the parameters panel visible or note.
Depending on the current loaded dataset, the "Display" submenu may also include an additional checkbox item as shown on the Figure 6.4. This checkbox allows the user to display or hide the main cities over the map. By default, if the dataset provides such a layer, it is checked.
Figure 6.4. Display submenu options: cities layer
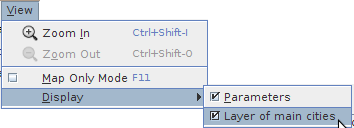
On this screenshot, the loaded dataset embeds the main cities. The "Display" menu allows to hide or display this additional layer.
When the Display-Cities menu item is enabled, cities are displayed over the maps as black squares, as shown on Figure 6.5. Note that for ergonomy reasons, to avoid overlapping between cities labels, the names of the cities are not displayed over the map. Nevertheless, a tooltip appears when the mouse comes over a square.
Figure 6.5. Displayed cities
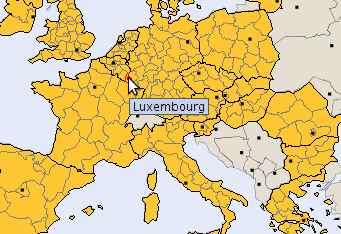
Cities are represented as black squares. The name of the city appears when the mouse moves over a square.
| |  | |
| 6.1. File menu |  | 6.3. Tools menu |