| 8.2. Appearances and functions of the mouse cursor | ||
|---|---|---|
 | Chapter 8. Tools |  |
| 8.2. Appearances and functions of the mouse cursor | ||
|---|---|---|
| | Chapter 8. Tools | |
 At any moment, the position of the mouse cursor on the map provides information
about the elementary unit that it points. The content of the table depends on the current map, Figure 8.1 shows
the case of the synthesis map where are displayed:
At any moment, the position of the mouse cursor on the map provides information
about the elementary unit that it points. The content of the table depends on the current map, Figure 8.1 shows
the case of the synthesis map where are displayed:
the name of the territorial unit
the code of this unit
numerator stock value
denominator stock value
ratio (numerator/denominator) value
relative deviations values based on the selected references
the absolute deviation values are only available in expert mode
Figure 8.1. Details box for the synthesis map
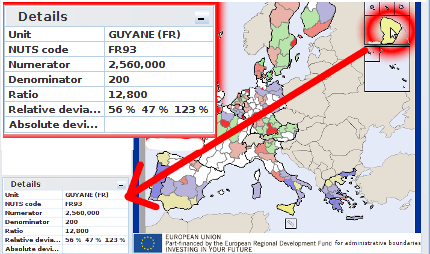
This screenshot shows the "Details" box on the left bottom corner of the application. The user's mouse is over the Guyane. Associated computed values to this unit are displayed in the box.
 Except for the synthesis map, a left click anywhere on the map changes the
function of the cursor to “Pan”, as long as this option is on (see Section 6.3).
Except for the synthesis map, a left click anywhere on the map changes the
function of the cursor to “Pan”, as long as this option is on (see Section 6.3).
 On the synthesis map, the "hand" mouse pointer shows that the
histogram function is on. A right click on a region opens its histogram synthesis view (see synthesis as an histogram).
On the synthesis map, the "hand" mouse pointer shows that the
histogram function is on. A right click on a region opens its histogram synthesis view (see synthesis as an histogram).
| |  | |
| 8.1. Review of available maps tabs |  | 8.3. Legends, options and explanation tabs |