| 7.3. Setting the indicators | ||
|---|---|---|
 | Chapter 7. MTA parameters |  |
| 7.3. Setting the indicators | ||
|---|---|---|
| | Chapter 7. MTA parameters | |
Standard HyperAtlas only works with size variables (that is to say that only variables that may be aggregated at upper level by sum), and proposes a multiscalar cartography of the ratio for two size variables in order to set the studied ratio. The user can combine every couple of these types of variables in the “Indicators” box, by choosing each of them in the associated select boxes as shown on Figure 7.3.
Figure 7.3. Indicators box
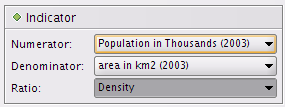
This box provides three select boxes to choose indicators. The user selected the Density item in the Ratio
select box:
Numerator is set to Population in 2003
Denominator is set to Area in km2
Ratio: depending on the chosen dataset (the hyp file), selecting a ratio may implie the auto-selection of the numerator and denominator fields values.
Three maps are respectively linked to these choices, under three different tabs (see Figure 7.4). The maps for the numerator and for the denominator (size variables) are represented with proportional circles. The ratio map is shown with colored units, according to the ratio value. The number of classes and their associated colors (the pallet tool) can be can be set in the "Option" tab of the ratio map.
Figure 7.4. Numerator, denominator and ratio tabs
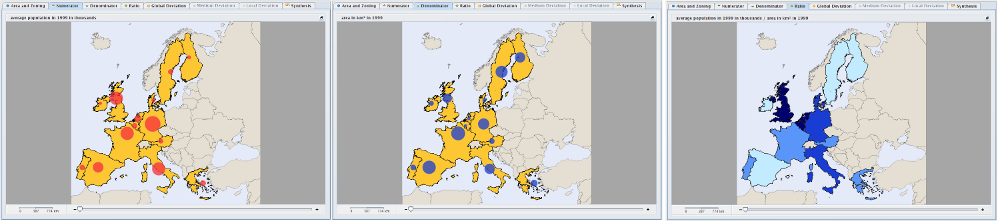
The three associated tabs to the chosen indicators are represented here for the study area EU 15 (15 countries in Europe)
with the NUTS 0 value (countries) for the elemetary zoning:
the image on the left shows the Numerator map within its associated tab, here, the population in 2003
the image in the center shows the Denominator map within its associated tab, here, the area in km2
the image on the right shows the Ratio map within its associated tab, here, the density.
| |  | |
| 7.2. Setting the Study Area |  | 7.4. Setting the contexts for deviations |