| 7.4. Setting the contexts for deviations | ||
|---|---|---|
 | Chapter 7. MTA parameters |  |
| 7.4. Setting the contexts for deviations | ||
|---|---|---|
| | Chapter 7. MTA parameters | |
As described in various contexts paragraph, the user has to define the three territorial contexts which respectively set three different levels of spatial observation: global, medium and local. Figure 7.5 shows the select boxes to set these parameters.
![[Caution]](../images/caution.gif) | |
The names of the references have been updated since the previous versions of Standard HyperAtlas:
|
Figure 7.5. Contexts box
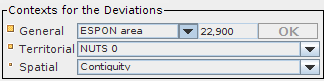
The "Contexts" box allows to set three references for their associated deviations: general, territorial and spatial contexts.
The general context may be the whole chosen study area. In such a case, the associated map will be the same as the associated map to the ratio itself. So, the user may choose another general context or a reference value. For instance, in the example of the EU, even if the study area is the 29 potential countries, it may be of interest to observe the spatial differentiations according to another global reference, for instance the global value associated to EU15. For this level, the user may also exogenously enter a value. By default, this value has first been set to the value of the global area.
The territorial context, on the other hand, has to be a geographical zoning that is an aggregation of the “elementary zoning” that was previously chosen.
The spatial context shows which proximity relation will be the basis of the neighborhood’s definition for each elementary unit. That is usually “contiguity”, but it may also be a relationship based on distances since they have been introduced in the hyp file (units that are less than X kilometers far from), or time-distances. Then, each elementary unit value will be compared to the value of its neighborhood.
A set of three maps are linked to these choices (Figure 7.6). The values of the deviations are transformed into global indexes 100. Thus, values may be interpreted in terms of percentage to the reference value. The maps are drawn with double progression frame centered on 100, in order to highlight the regions that are under the reference value (100), and the ones that have upper values.
Figure 7.6. Deviations maps tabs
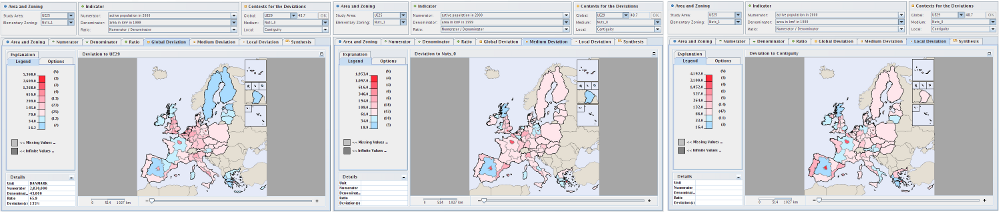
These screenshots show the three deviations maps tabs for chosen contexts: general deviation on the left, territorial deviation in the center and spatial deviation on the right.
| |  | |
| 7.3. Setting the indicators |  | 7.5. The synthesis maps |