| 9.1. Lorenz curve and statistical indexes | ||
|---|---|---|
 | Chapter 9. Standard HyperAtlas Expert Mode |  |
| 9.1. Lorenz curve and statistical indexes | ||
|---|---|---|
| | Chapter 9. Standard HyperAtlas Expert Mode | |
The map of large deviation provided by Standard HyperAtlas is a general measure of disparities for a given variable Z which is the ratio between two stocks X and Y. This estimation of general disparities can be further analysed using various econometric indexes that have been added in Standard HyperAtlas v2 expert mode:
the Lorenz curve typically presents the cumulative proportion of population and resource when starting from regions with lowest resource per inhabitant.
the Gini Coefficient is a summary of the Lorenz curve measuring the global amount of disparities: it is equal to the area located between the Lorenz Curve and the diagonal (perfect-equality)..
the Hoover index, also called Disparity index, is another summary of the Lorenz Curve, as it is equal to the maximum distance between Lorenz Curve and diagonale.
The Coefficient of Variation is simply equal to the ratio between standard deviation and average of the considered ratio Z.
![[Note]](../images/note.gif) | |
A complete description of the Lorenz curve and of the main statistical indexes is directly available in a dedicated "Explanation" panel of the statistical box, close to the curve panel, as shown on Figure 9.2. |
Figure 9.2. Lorenz curve, statistical indexes and explanations
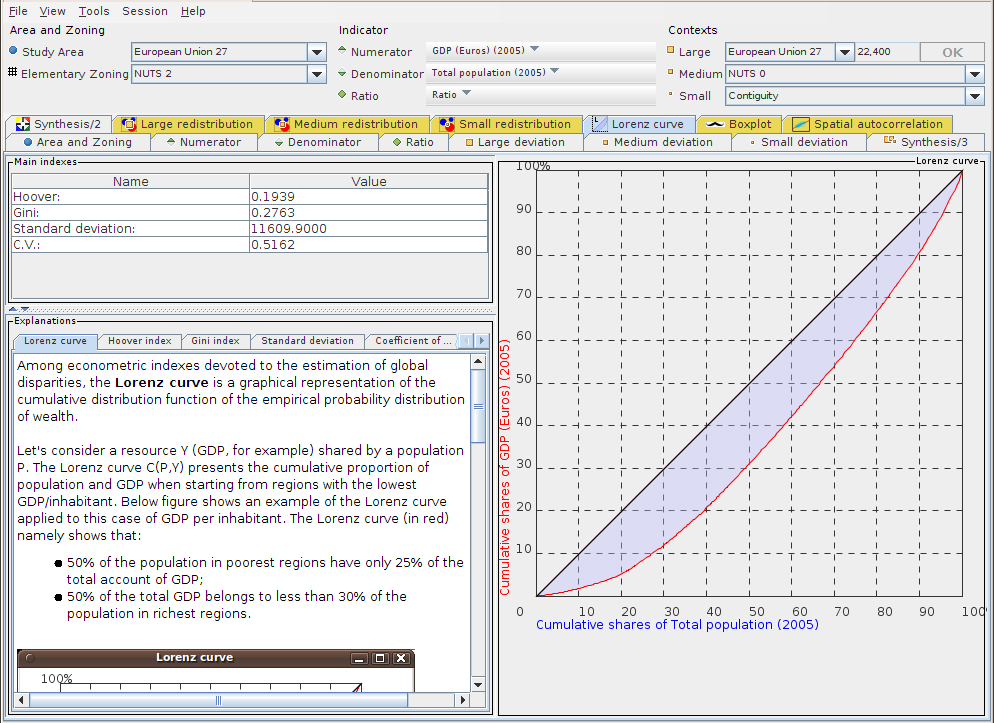
This tab shows the Lorenz curve, a table of main statistical indexes, and an "Explanations" titled panel providing some information for each feature.
| |  | |
| Chapter 9. Standard HyperAtlas Expert Mode |  | 9.2. Equi-repartition map |