| 8.5. Report | ||
|---|---|---|
 | Chapter 8. Tools |  |
| 8.5. Report | ||
|---|---|---|
| | Chapter 8. Tools | |
The user can save his current whole collection of maps with the associated rough data and deviations by selecting the "File - Build Report" menu item from the menu bar.
By selecting this menu item, the user is invited to select a directory on his/her disk where the report will be generated as a set of HTML page (index.html
and eight PNG image files (one image per map: map0.png, map1.png, to map7.png).
For example, if the user selected his /home/toto/my_hyperatlas_report/ directory as target directory, he/she may open the saved report from a web browser
by selecting the /home/toto/my_hyperatlas_report/index.html file.
The generated report may be divided in the three-fold:
the introduction shows the space area, chosen indicators and contexts
the list of maps for these parameters as images files
the table of generated results for these parameters
![[Note]](../images/note.gif) | |
In expert mode, the generated report also includes expert tabs as images:
|
Figure 8.5. Screenshot of a generated report
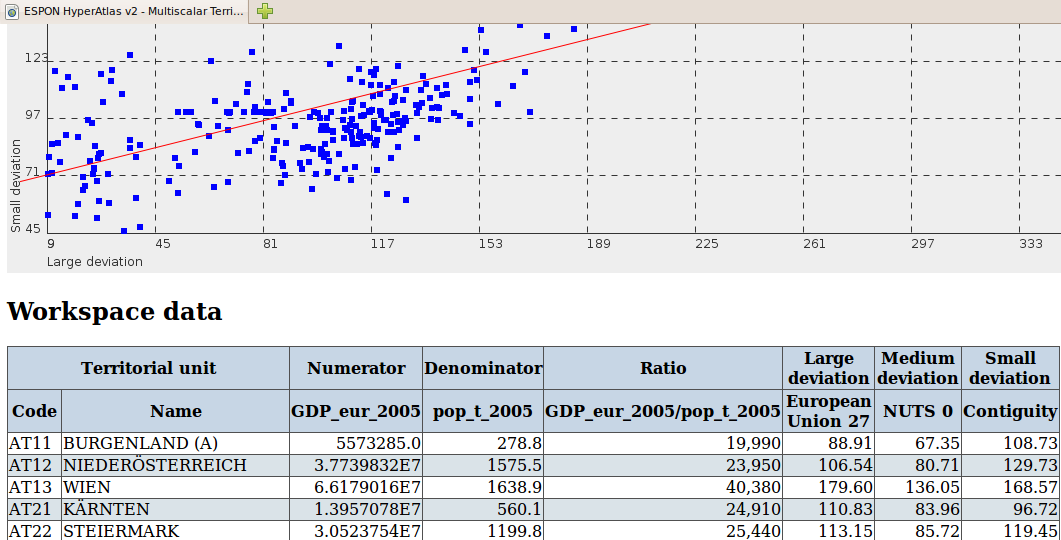
This screenshot shows an extract of the generated report index.html file that has been opened by in web browser.
This image shows the last map (synthesis) and the start of the table that includes all results.
| |  | |
| 8.4. Zoom |  | Chapter 9. ESPON HyperAtlas Expert Mode |