| 9.4. Spatial autocorrelation chart | ||
|---|---|---|
 | Chapter 9. Standard HyperAtlas Expert Mode |  |
| 9.4. Spatial autocorrelation chart | ||
|---|---|---|
| | Chapter 9. Standard HyperAtlas Expert Mode | |
The spatial autocorrelation chart is only available when the expert mode is enabled.
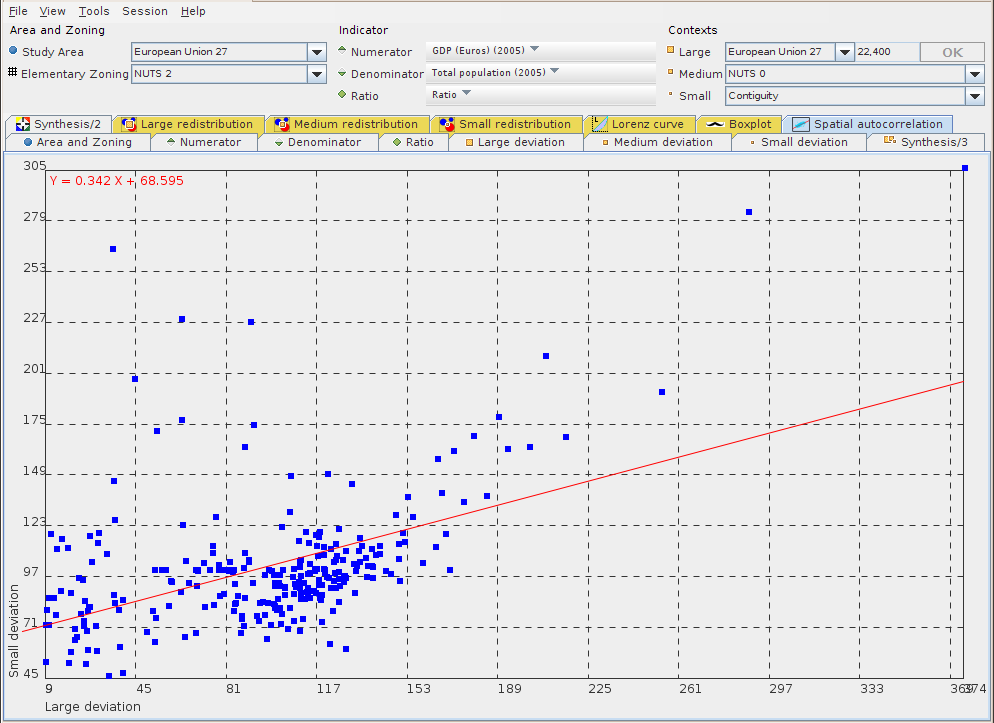
For each territorial unit of the study area, this chart crosses the values of the spatial deviation on absissa axis with the values of the territorial deviation on ordinates axis.
This chart is very interesting for expert users as it reveals spatial dependancy, e.g. spatial organization of a phenomena.
More empirically, the chart can also be used to examine the situation of outliers and exceptional units out of the cloud of points.
The compute of this chart is based on a Moran's coefficient of spatial autocorrelation variant. The regression line is drawn in red on the chart, its equation, computed by the least squares method, is displayed on the left corner of the frame, as shown on Figure 9.5.
Each unit is drawn as a blue square, its name is displayed in a tooltip when the mouse comes over the square.
| |  | |
| 9.3. Boxplots chart |  | Part III. HyperAdmin |