| 9.3. Boxplots chart | ||
|---|---|---|
 | Chapter 9. Standard HyperAtlas Expert Mode |  |
| 9.3. Boxplots chart | ||
|---|---|---|
| | Chapter 9. Standard HyperAtlas Expert Mode | |
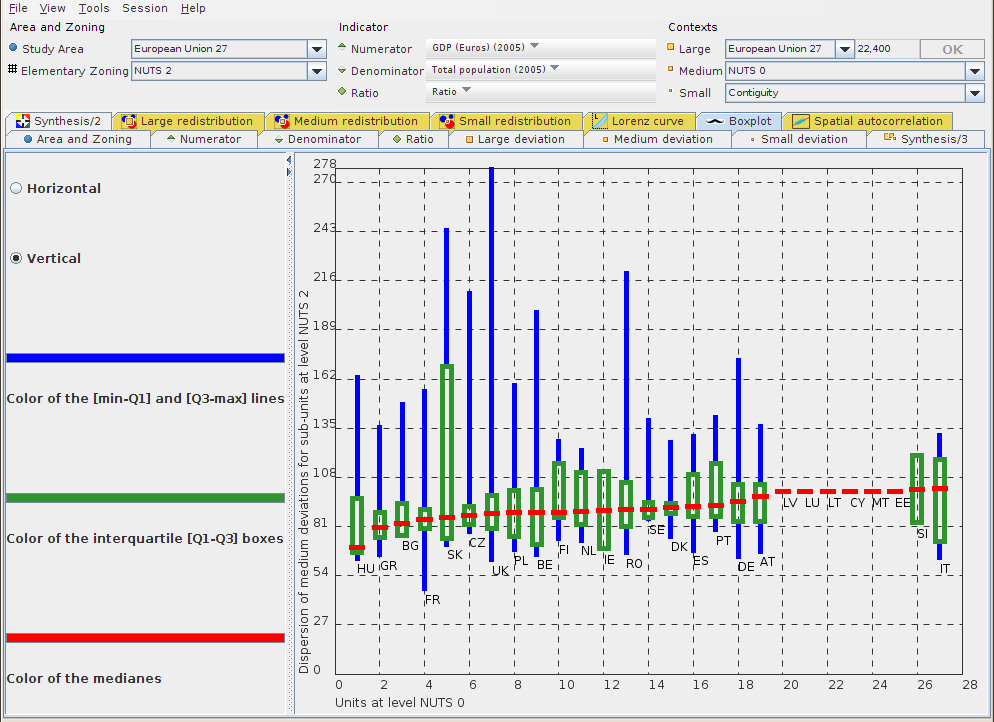
For each unit in the chosen medium context (NUTS 0 for example in Figure 9.4), this chart shows the dispersion of the medium deviation for the territorial units at sub-levels (NUTS 2 level in Figure 9.4).
A boxplot typically provides the following information:
two lines show the values between:
the minimum and first quarter Q1
the third quarter and maximum Q3
a box shows the interquartile Q1-Q3
a line shows the mediane value
| |  | |
| 9.2. Equi-repartition map |  | 9.4. Spatial autocorrelation chart |